Quick Overview: Difference between revisions
(→Using the Graph: update with queries) |
(added quick nav (+ gallery test)) |
||
| Line 1: | Line 1: | ||
__NOTOC__ | |||
For more indepth examples and explanations visit the following: | |||
{| class="mw-collapsible mw-expanded wikitable" style="margin:auto" | |||
|- | |||
! Link !! What you will find !! Preview | |||
|- | |||
| [[Courses/CGBV]] || An overview of the Course "Computergraphik und Bildverarbeitung" || | |||
|- | |||
| [[Feature_Demo]] || A demo of a couple of features || | |||
|- | |||
| [[GraphStructure]] || The documentation of the graph structure || [[File:Graph-structure.png|thumb|upright=0.75]] | |||
|- | |||
| [[ExampleStudent]] || An example on how a student can use the graph || | |||
|- | |||
| [[Quiz/CGBV-SL2]] || An example of how coursework is integrated || | |||
|} | |||
<gallery mode="packed-hover"> | |||
Image:Graph-structure.png| ''[[GraphStructure|The Graph Structure]]'' | |||
</gallery> | |||
= The Dependency Graph = | = The Dependency Graph = | ||
Revision as of 14:46, 25 September 2023
For more indepth examples and explanations visit the following:
| Link | What you will find | Preview |
|---|---|---|
| Courses/CGBV | An overview of the Course "Computergraphik und Bildverarbeitung" | |
| Feature_Demo | A demo of a couple of features | |
| GraphStructure | The documentation of the graph structure | |
| ExampleStudent | An example on how a student can use the graph | |
| Quiz/CGBV-SL2 | An example of how coursework is integrated |

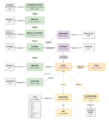
The Dependency Graph
At the lowest level the graph is structured by linking learning contents to its prerequisite(s) and useful resources. A student can now use these links to determine how items depend on each other, and what knowledge is required to understand a specific item.

In the end the graph turns into a big interconnected structure:
In order to make this amount of data useable, several Structure-Items have been defined to help group items into abstract categories.
For a more detailed explanation of the entire underlying structure go to GraphStructure or take a quick look at these following diagrams:
The base structure
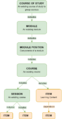
Connection of courses
Dependencies and use

Using the Graph
The graph itself is more a database, than a tool. In order to make it usable several ideas have been devised and implemented. Here's a quick example of what is possible on site.
Timeline of Course Sessions
Overview of Student
Shows what items a Student is has linked their item to. Can be used to track progress.
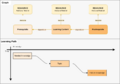
Learning path
The complete path to an item (here: Virtual Cameras) and what's next.
NOTE: Color coding was currently not possible for this specific case.Course Work
What items are used in a mandatory coursework:
The learning path to wd:Q451